About:
Reftab’s asset tracking and management system can track how your assets depreciate over time so you know how much they are worth compared to when you purchased them.
In this post, we’re going to show you how to setup depreciation on your assets run depreciation reports and, how to build a chart within Reftab.
Depreciation is calculated using US GAAP Rules and uses the standard method of “Straight Line Depreciation” when calculating from the asset’s purchase date.
Reftab can calculate depreciation:
- Monthly
- Yearly
Click here to go directly to reports
Setup:
Depreciation works by looking at specific fields on your categories that you designate within the depreciation page in settings. To start, you’ll need to configure at least 3 fields and save them to at least one category:
- Asset Purchase Price
- Depreciation Lifespan
- Depreciation Purchase Date
Please note that fields with a currency value will need to have the field type set to “Monetary”

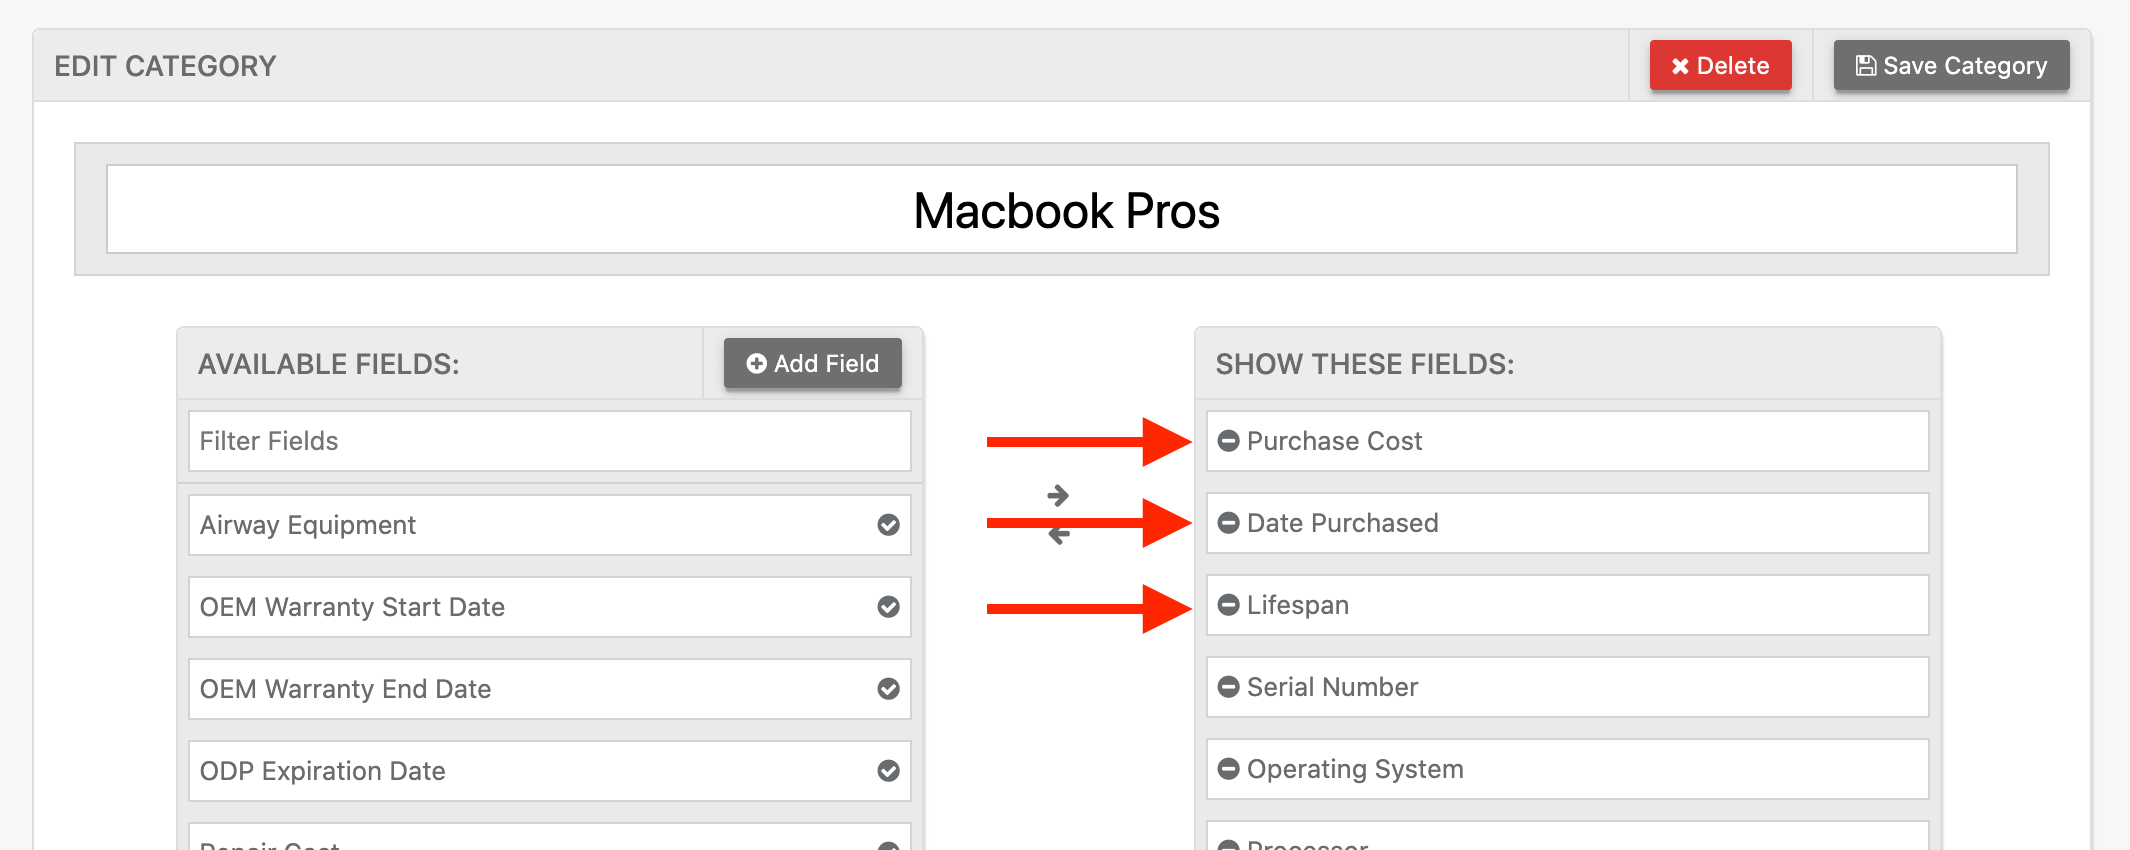
1) Click “Asset Categories” and create a field to use for each of the fields listed above, and drag them to the column, “Show These Fields” and click “Save Category”.
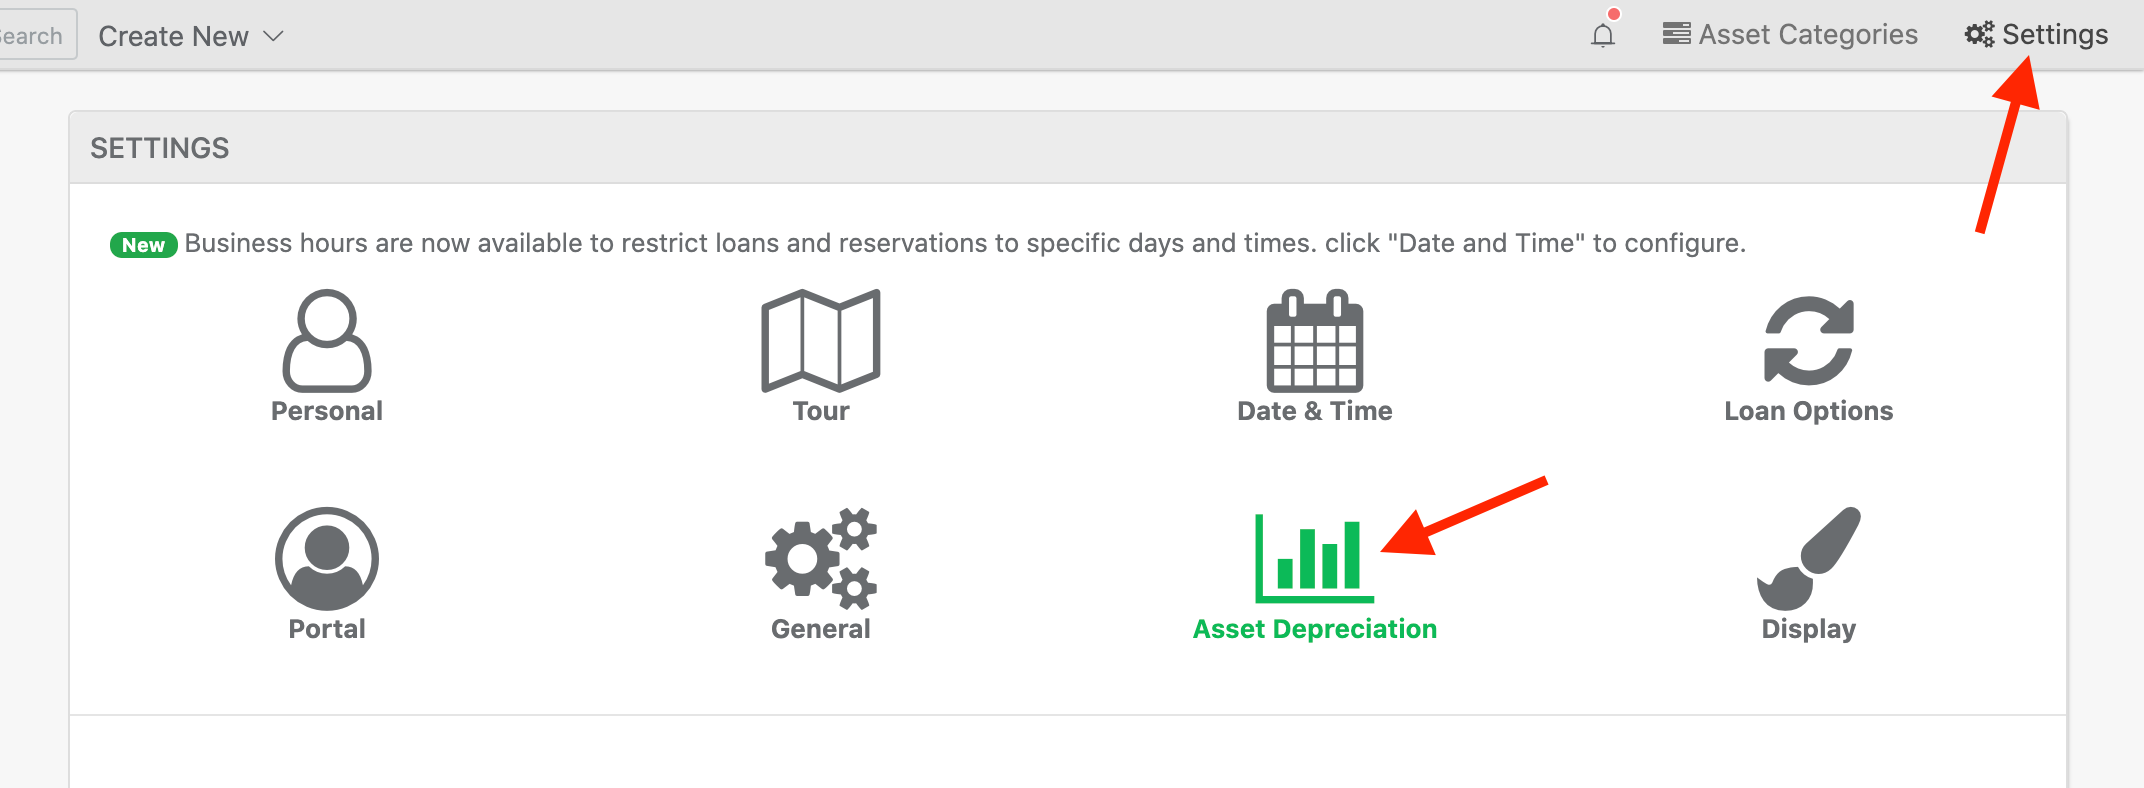
2) Next, click “Settings” > “Asset Depreciation”.
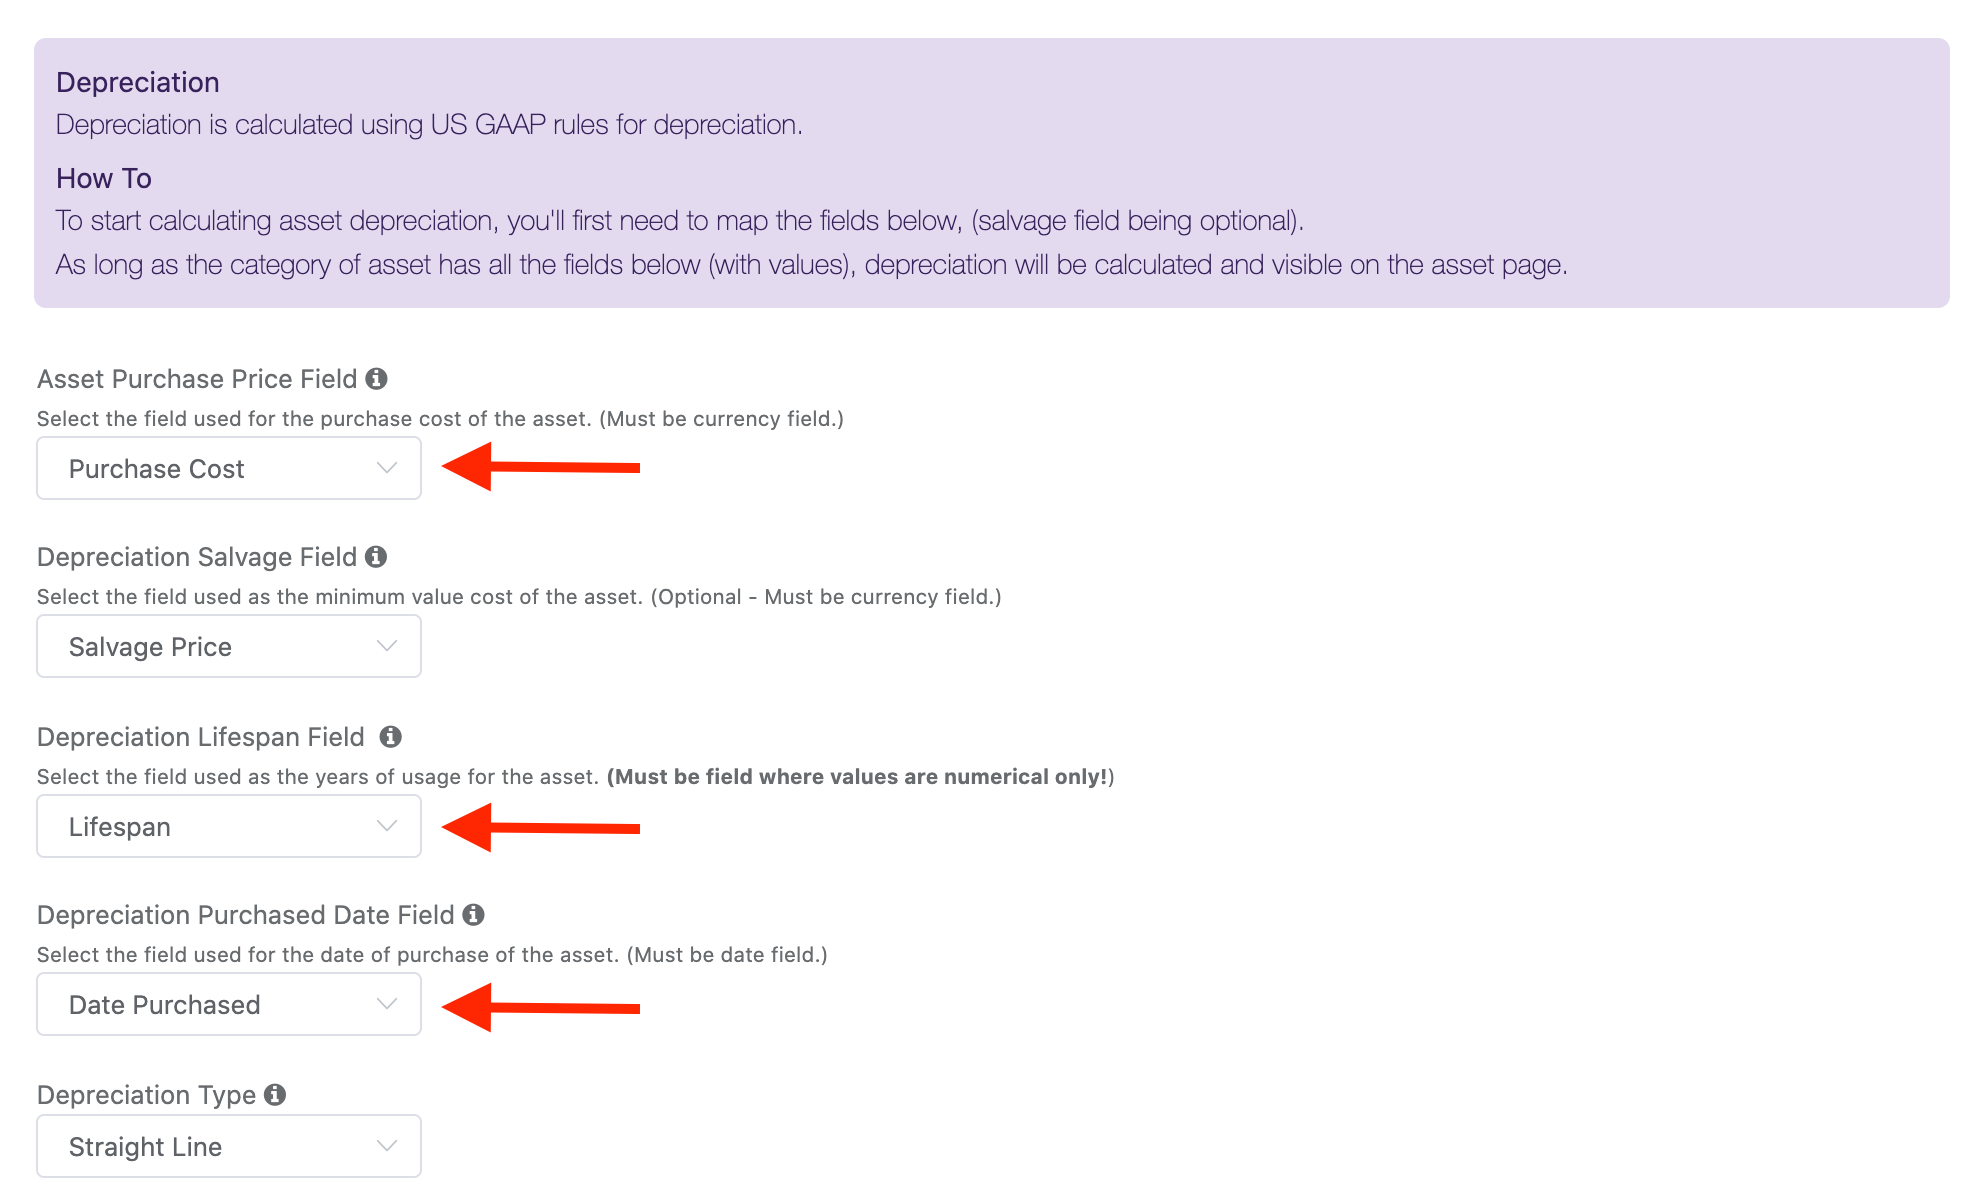
3) Next, assign the three fields to each depreciation field that they correspond with and click, “Save system-wide Settings”.
4) Now you are ready to start calculating deprecation. Simply edit any asset that has your three depreciation fields and fill in the values and save.
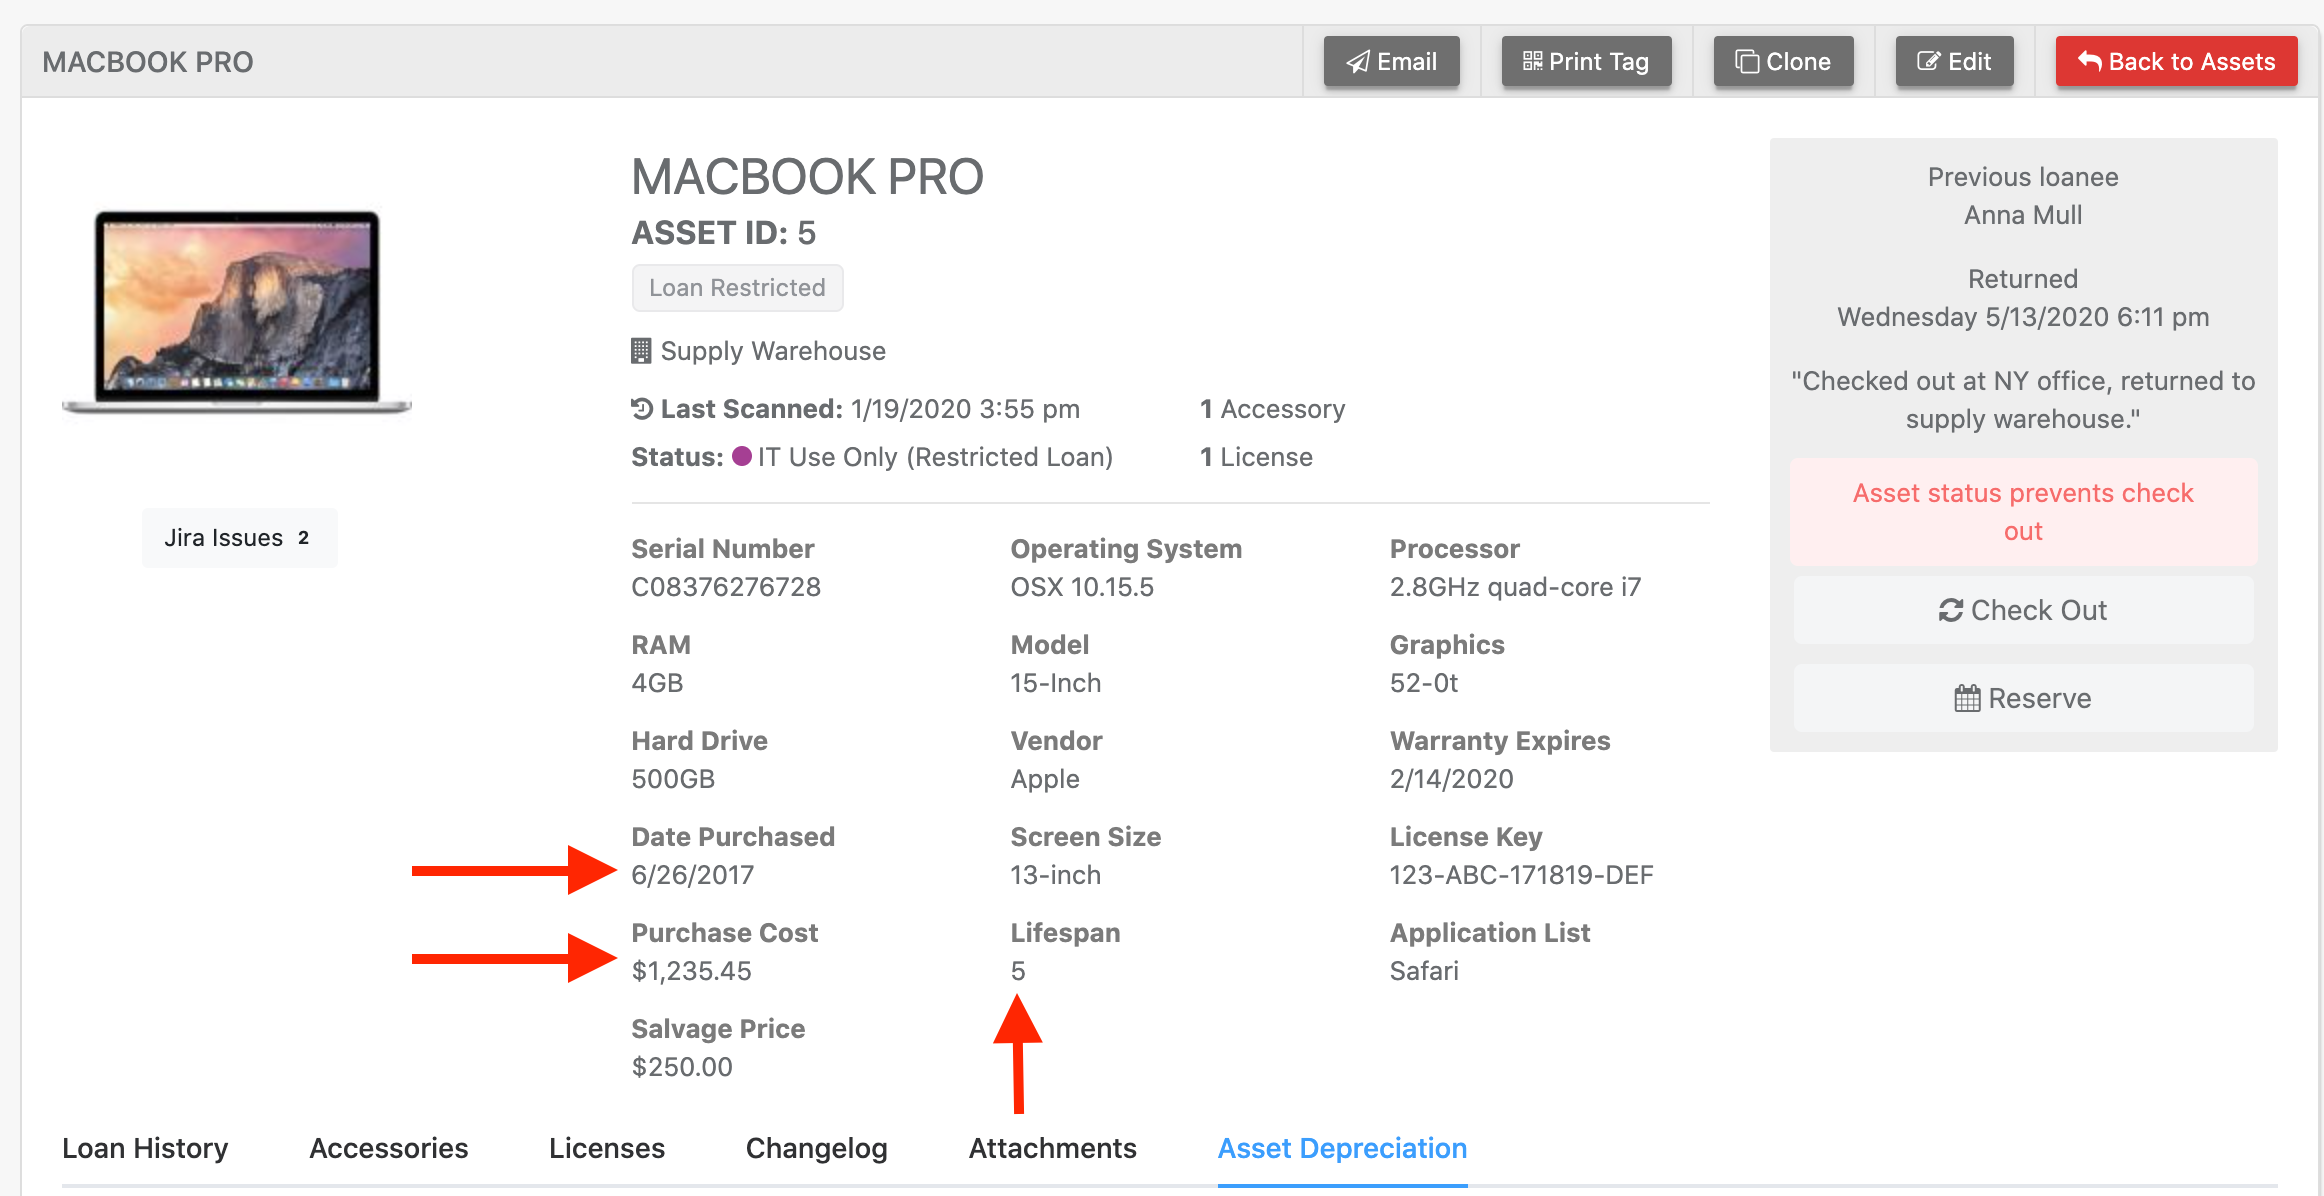
5) Then, click the tab “Asset Depreciation” and you will see depreciation values calculated.
The table will show 3 columns:
- Year – Shows a row for each year of the asset’s lifespan.
- Depreciated Value – Shows the value of the asset as it depreciates.
- Total Cumulative Depreciation – How much the asset deprecated since it was purchased.

Running a Depreciation Report
You can run a report to show depreciation like so:
Click “Reports” > “New Report“
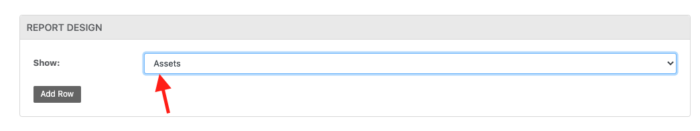
In the Report Design section select “Show Assets“
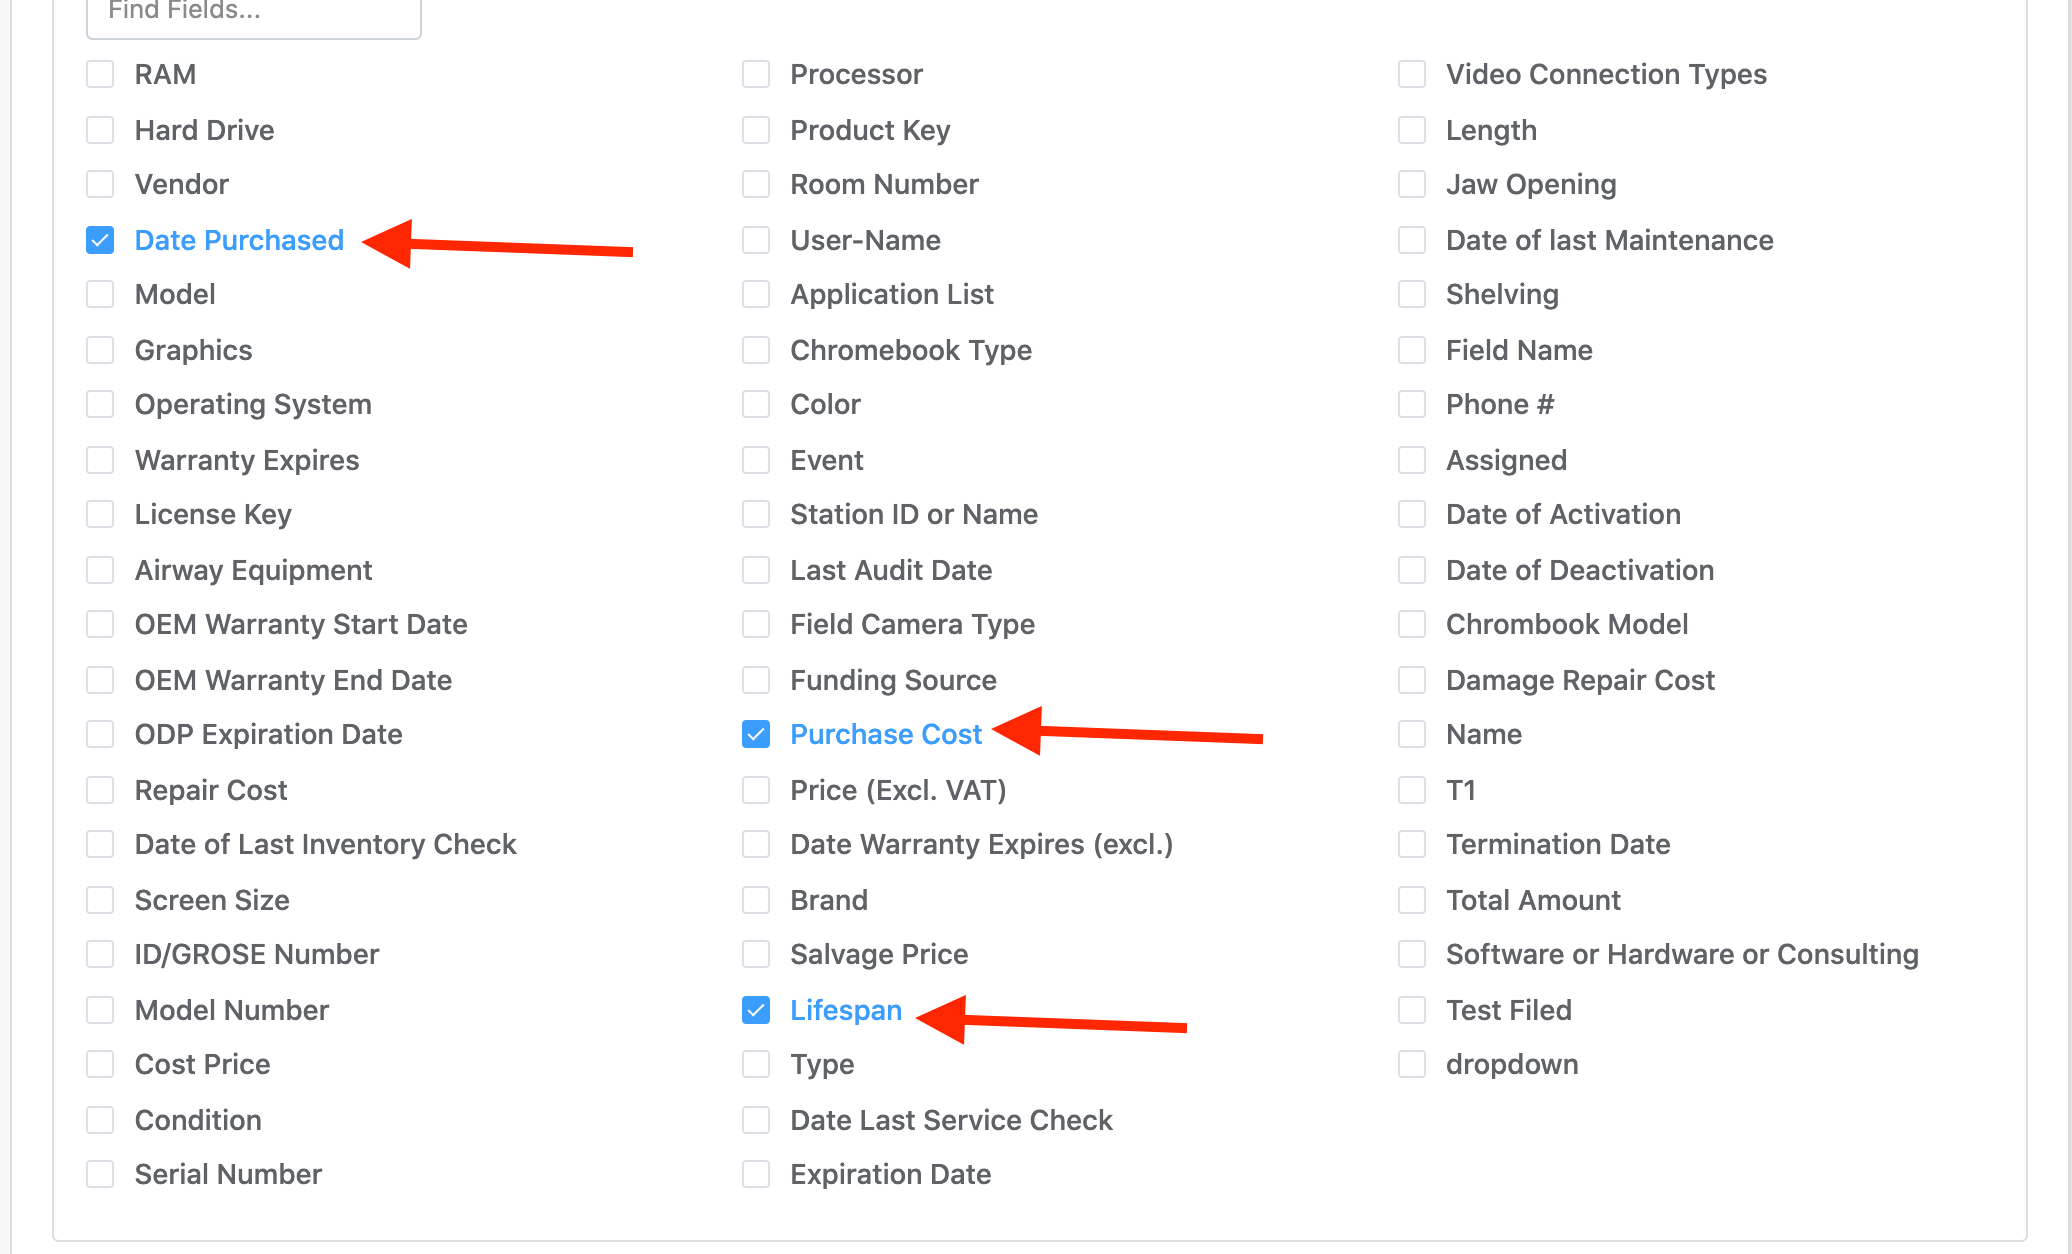
Next, in the fields section, check the boxes for your three depreciation fields:
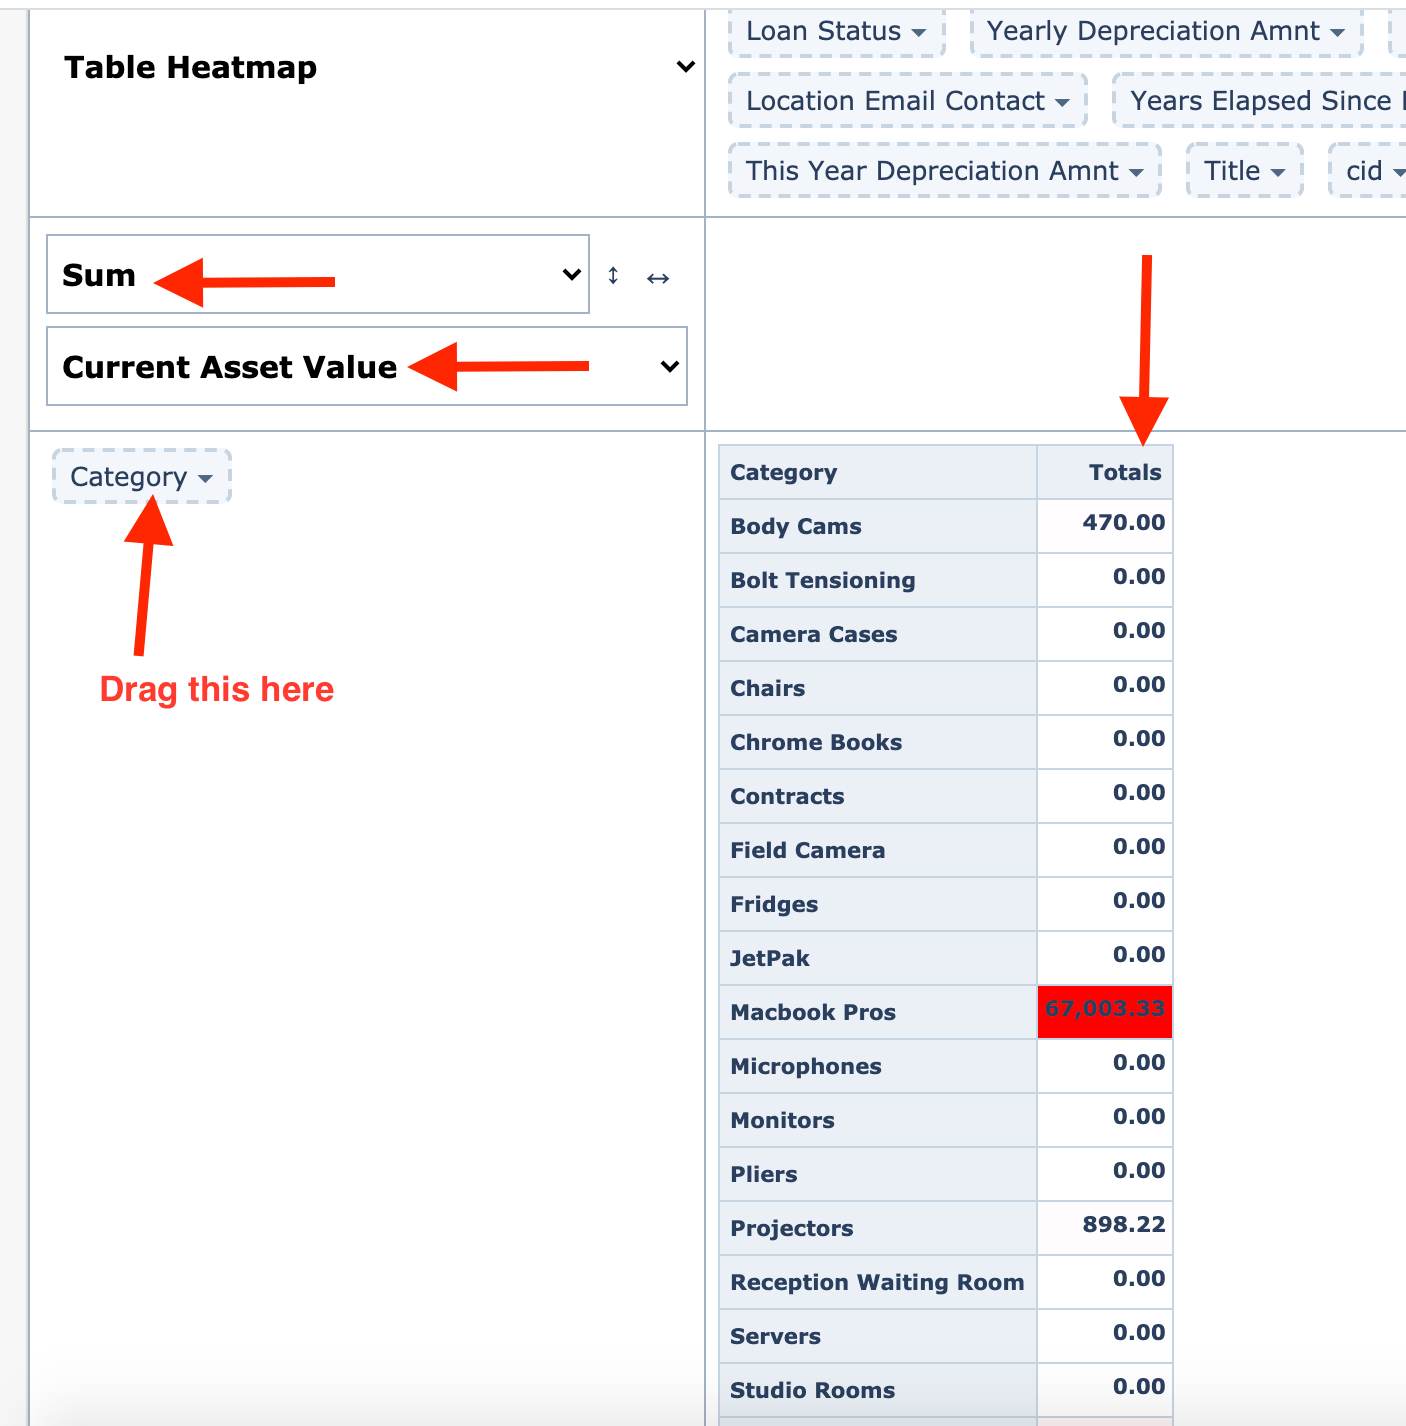
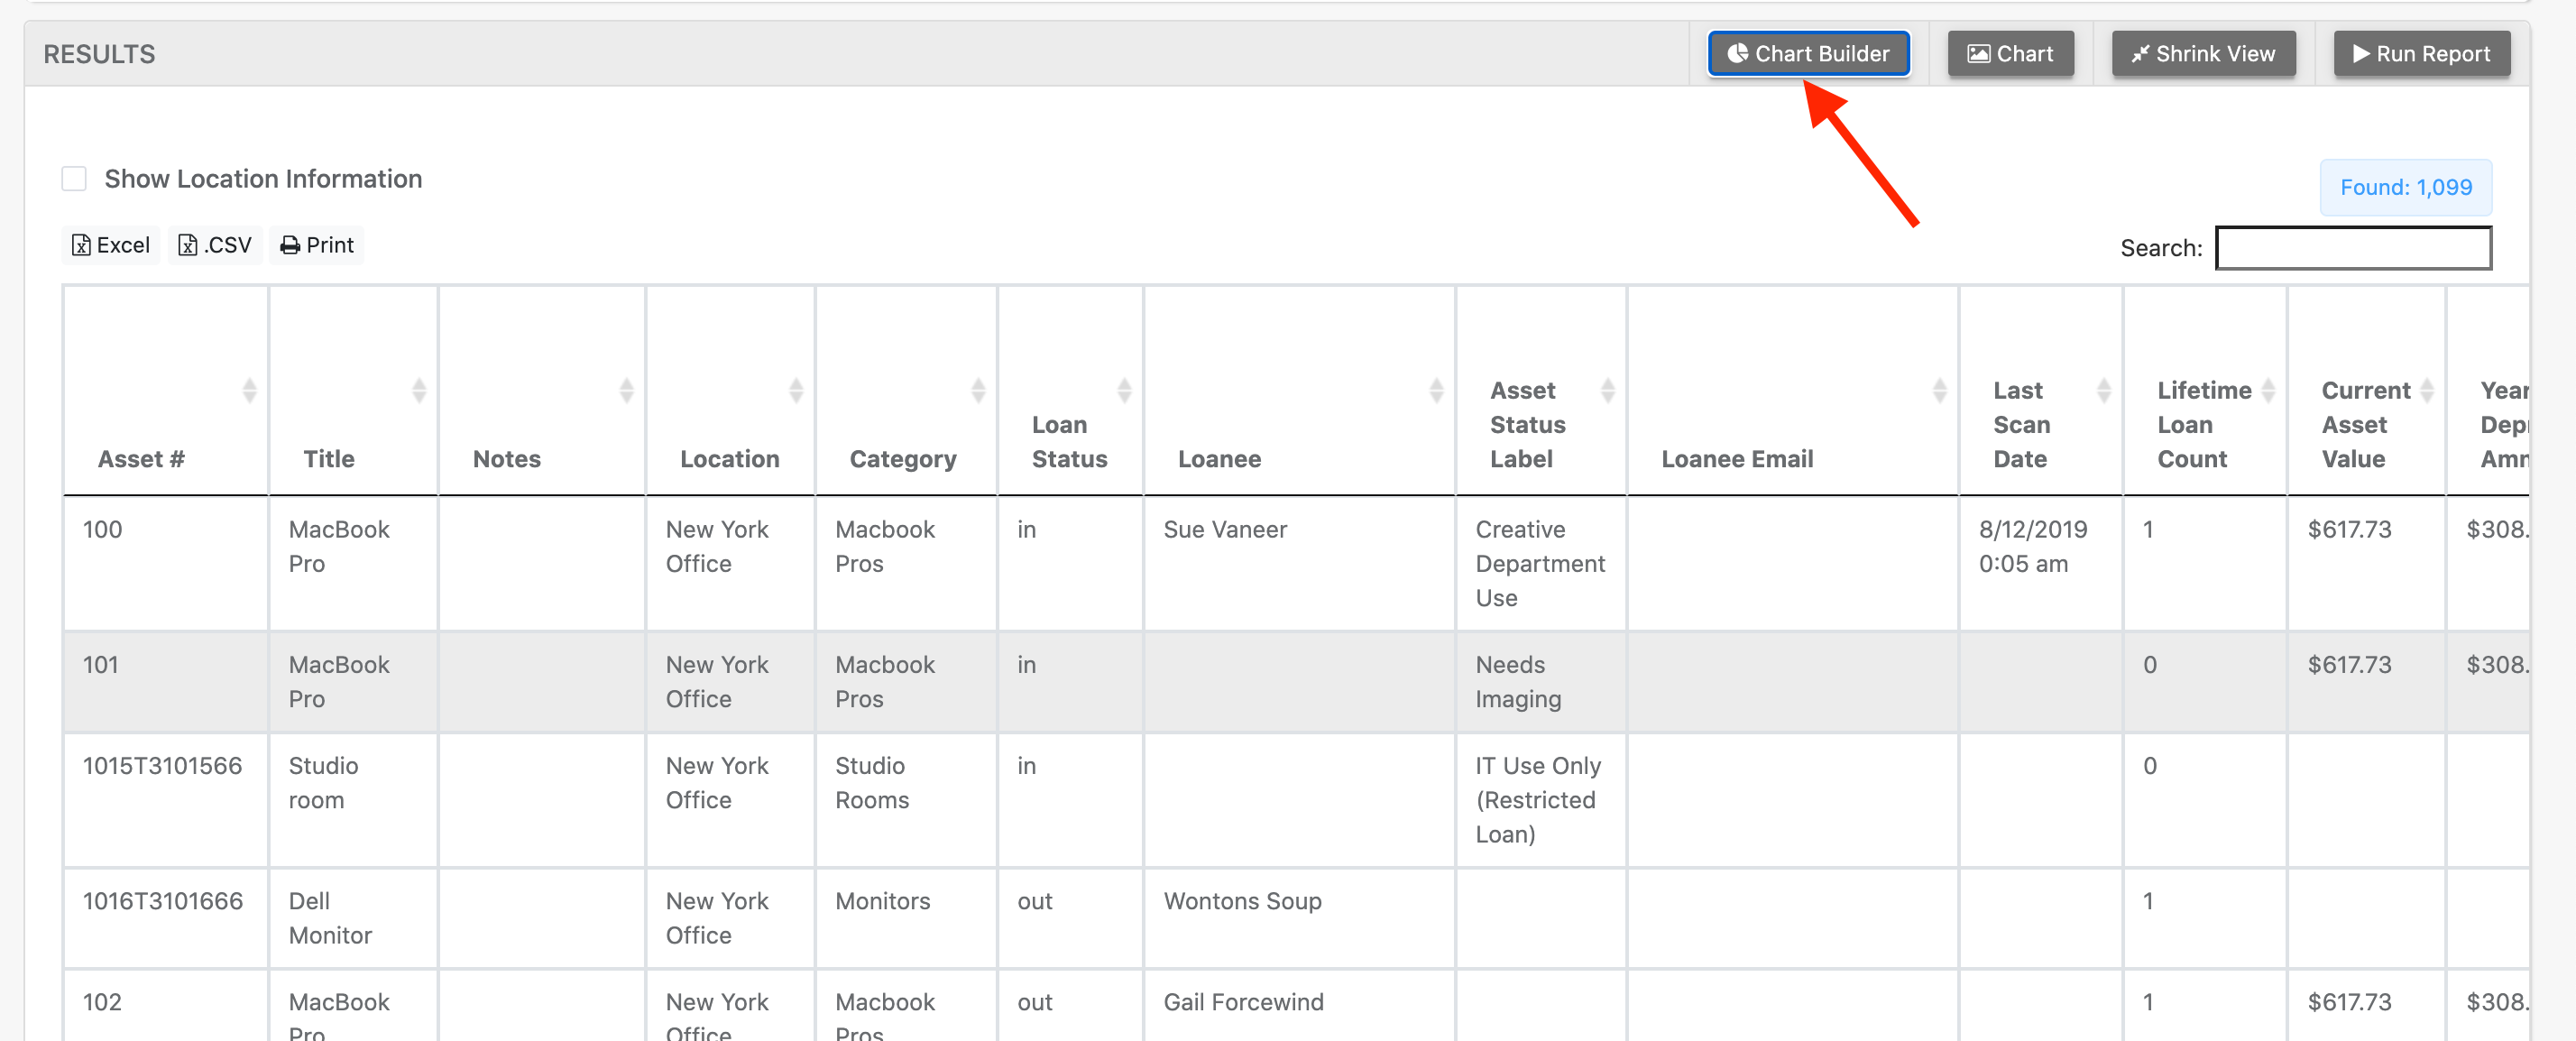
Results will show in a table. From here, you can see a column for “Current Asset Value” filled out for each asset as well as values for “This Year Depreciation Amount”, and “Years Elapsed Since Purchase Date”. At this point you may click “Chart Builder” to see more meaningful data and build charts:
For example, you can build a chart by selecting “Sum” and “Current Asset Value”. This will show you an easy-to-read table that will display a sum of all values for each asset’s current value. (This also allows you to avoid doing any extra work in Excel).